Saturday, July 26, 2008

Lift-to-drag ratio

From Wikipedia, the free encyclopedia

In aerodynamics, the lift-to-drag ratio, or L/D ratio ("ell-over-dee" in the US, "ell-dee" in the UK), is the amount of lift generated by a wing or vehicle, compared to the drag it creates by moving through the air. A "better" L/D ratio is one of the major goals in wing design, since a particular aircraft's needed lift doesn't change, delivering that lift with lower drag leads directly to better fuel economy, climb performance and glide ratio.

The term is calculated for any particular speed by measuring the lift generated, then dividing by the drag it causes. These vary with speed, so the results are typically plotted on a 2D graph. In almost all cases the graph forms a U-shape, due to the two main components of drag on the wing.

Drag

Induced drag is caused by the generation of lift by the wing. Lift generated by a wing is perpendicular to the wing, but since wings typically fly at some small angle of attack, this means that a component of the force is directed to the rear. The rearward component of this force is seen as drag. At low speeds an aircraft has to generate lift with a higher angle of attack, thereby leading to greater induced drag. This term dominates the low-speed side of the L/D graph, the left side of the U.

Profile drag is caused by air hitting the wing itself. This form of drag, simply another name for wind resistance, varies with the square of speed (see drag equation). For this reason profile drag is only a real factor at higher speeds, forming the right side of the L/D graph's U shape. Profile drag is lowered primarily by using thinner wings, but such a shape often leads to less low-speed lift, and thus higher induced drag.

The drag curve
The drag curve

It is the bottom point of the graph, the point where the combined drag is at its lowest, that the wing is performing at its best. For this reason designers will typically select a wing with its L/D peak at the chosen cruising speed of the aircraft, thereby maximizing economy. Like all things in aeronautical engineering, the lift-to-drag ratio is not the only consideration for wing design. Performance at high angle of attack and a gentle stall are often considered more important, and for this reason easy-to-fly wing designs like the Clark-Y continue to be used even though many more efficient wings have since been designed.

Glide ratio

As the aircraft fuselage and control surfaces will also add drag and possibly some lift, it is fair to consider the L/D of the aircraft as a whole. As it turns out, the glide ratio, which is the ratio of an (unpowered) aircraft's descent to its forward motion, is numerically equal to the aircraft's L/D. This is especially of interest in the design and operation of high performance gliders (called sailplanes), which can have glide ratios approaching 60 to 1 (60 units of distance forward for each unit of descent) in the best cases, but with 30:1 being considered good performance for general recreational use. Achieving a sailplane's best L/D in practice requires precise control of airspeed and smooth and restrained operation of the controls to reduce drag from deflected control surfaces. In zero wind conditions, L/D will equal altitude lost divided by distance traveled. Achieving the maximum distance for altitude lost in wind conditions requires further modification of the best airspeed, as does alternating cruising and thermaling. To achieve high speed across country, gliders are often loaded with water ballast to increase the airspeed (allowing better penetration against a headwind). As noted below, to first order the L/D is not dependent on speed, although the faster speed means the airplane will fly at higher Reynold's number.

Maximum range

For maximum range, one should fly at the point on the graph with minimum drag. Since the lift on an aircraft must equal the weight, this point is equal to the maximum L/D point. (The speed should decrease a bit during the flight because the optimal speed decreases as the plane uses up fuel and becomes lighter.) Because this theoretical speed may still be slightly exceeded without significant losses in efficiency, the "long range cruise speed" is normally slightly higher than the maximum range speed. There is a trade-off between saving fuel and saving time. The upper limit of speed is dictated by available (continuous) thrust and is not shown on the graph.

Theory

Mathematically, the maximum lift-to-drag ratio can be estimated as:

(L/D)_{max} = \frac{1}{2} \sqrt{\frac{\pi A \epsilon}{C_{D,0}}}[1],

where A is the aspect ratio, ε is the aircraft's efficiency factor, and CD,0 is the zero-lift drag coefficient.

Supersonic/hypersonic lift to drag ratios

At very high speeds, lift to drag ratios tend to be lower. Concorde had a lift/drag ratio of around 7 at Mach 2, whereas a 747 is around 17 at about mach 0.85.

Dietrich Küchemann developed an empirical relationship for predicting L/D ratio for high Mach:[2]

L/D_{max}=\frac{4(M+3)}{M}


Windtunnel tests have shown this to be roughly accurate.

Examples

The following table includes some representative L/D ratios.

Flight article Scenario L/D ratio
Modern Sailplane gliding ~60
Virgin Atlantic GlobalFlyer Cruise 37[3]
Lockheed U-2 Cruise ~28
Rutan Voyager Cruise[4] 27
Albatross
20[5]
Boeing 747 Cruise 17
Gimli glider Fuel exhaustion ~12
Common tern
12[5]
Herring gull
10[5]
Concorde M2 Cruise 7.14
Cessna 150 Cruise 7
Concorde Approach 4.35
House sparrow
4[5]
Apollo CM Reentry 0.368[6]

References

  1. ^ Loftin, LK, Jr.. "Quest for performance: The evolution of modern aircraft. NASA SP-468". Retrieved on 2006-04-22.
  2. ^ Aerospaceweb.org Hypersonic Vehicle Design
  3. ^ David Noland, "Steve Fossett and Burt Rutan's Ultimate Solo: Behind the Scenes," Popular Mechanics, Feb. 2005 (web version)
  4. ^ David Noland, "Steve Fossett and Burt Rutan's Ultimate Solo: Behind the Scenes," Popular Mechanics, Feb. 2005 (web version)
  5. ^ a b c d Fillipone
  6. ^ Hillje, Ernest R., "Entry Aerodynamics at Lunar Return Conditions Obtained from the Flight of Apollo 4 (AS-501)," NASA TN D-5399, (1969).

See also

Buoyancy

From Wikipedia, the free encyclopedia

The forces at work in buoyancy

In physics, buoyancy (BrE IPA: ˈbɔɪənsi) is the upward force on an object produced by the surrounding liquid or gas in which it is fully or partially immersed, due to the pressure difference of the fluid between the top and bottom of the object. The net upward buoyancy force is equal to the magnitude of the weight of fluid displaced by the body. This force enables the object to float or at least to seem lighter. Buoyancy is important for many vehicles such as boats, ships, balloons, and airships, and plays a role in diverse natural phenomena such as sedimentation.

Archimedes' principle

It is named after Archimedes of Syracuse, who first discovered this law. Vitruvius (De architectura IX.9–12) recounts the famous story of Archimedes making this discovery while in the bath (for which see eureka) but the actual record of Archimedes' discoveries appears in his two-volume work, On Floating Bodies. The ancient Chinese child prodigy Cao Chong also applied the principle of buoyancy in order to measure the accurate weight of an elephant, as described in the Sanguo Zhi.

This is true only as long as one can neglect the surface tension (capillarity) acting on the body.[1]

The weight of the displaced fluid is directly proportional to the volume of the displaced fluid (specifically if the surrounding fluid is of uniform density). Thus, among objects with equal masses, the one with greater volume has greater buoyancy.

Suppose a rock's weight is measured as 10 newtons when suspended by a string in a vacuum. Suppose that when the rock is lowered by the string into water, it displaces water of weight 3 newtons. The force it then exerts on the string from which it hangs will be 10 newtons minus the 3 newtons of buoyant force: 10 − 3 = 7 newtons. This same principle even reduces the apparent weight of objects that have sunk completely to the sea floor, such as the sunken battleship USS Arizona at Pearl Harbor, Hawaii. It is generally easier to lift an object up through the water than it is to finally pull it out of the water. And, it also works with boiled eggs, salt, and fresh water.

The density of the immersed object relative to the density of the fluid is easily calculated without measuring any volumes:

 \frac { \mbox{Density of Object}} { \mbox {Density of Fluid} } = \frac { \mbox{Weight} } { \mbox{Weight} - \mbox{Apparent immersed weight} }\,

Forces and equilibrium

Pressure increases with depth below the surface of a liquid. Any object with a non-zero vertical depth will see different pressures on its top and bottom, with the pressure on the bottom being higher. This difference in pressure causes the upward buoyancy force.

The magnitude of buoyant force may be appreciated from the following argument. Consider any volume of liquid of arbitrary shape and volume V\,. The body of liquid being in equilibrium, the net force the surrounding body of liquid exerts on it must be equal to the weight of that volume of liquid and directed opposite to gravitational force. That is, of magnitude:

\rho V g \, , where \rho\, is the density of the liquid, V\, is the volume of the body of liquid , and g\, the standard gravity (\scriptstyle\approx\, -9.8 N/kg on Earth)

Now, if we replace this volume of liquid by a solid body of the exact same shape, the force the surrounding body of liquid exerts on it must be exactly the same as above. In other words the "buoyant force" on a submerged body is directed in the opposite direction to gravity and is equal in magnitude to : \rho V g \, ( note that here V\, is the volume of fluid displaced by the body )

The net force on the object is thus the net force of buoyancy and the object's weight

F_\mathrm{net} = mg - \rho V g \,

If the buoyancy of an (unrestrained and unpowered) object exceeds its weight, it tends to rise. An object whose weight exceeds its buoyancy tends to sink.

It is common to define a buoyant mass mb that represents the effective mass of the object with respect to gravity

m_{b} = m_{\mathrm{o}} \cdot \left( 1 - \frac{\rho_{\mathrm{f}}}{\rho_{\mathrm{o}}} \right)\,

where m_{\mathrm{o}}\, 
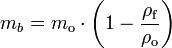
is the true (vacuum) mass of the object, whereas ρo and ρf are the average densities of the object and the surrounding fluid, respectively. Thus, if the two densities are equal, ρo = ρf, the object appears to be weightless. If the fluid density is greater than the average density of the object, the object floats; if less, the object sinks.

Compressive fluids

The atmosphere's density depends upon altitude. As an airship rises in the atmosphere, its buoyancy reduces as the density of the surrounding air reduces. The density of water is essentially constant: as a submarine expels water from its buoyancy tanks (by pumping them full of air) it rises because its volume stays the same (the volume of water it displaces if it is fully submerged) while its weight is decreased.

Compressible objects

As a floating object rises or falls the forces external to it change and, as all objects are compressible to some extent or another, so does the object's volume. Buoyancy depends on volume and so an object's buoyancy reduces if it is compressed and increases if it expands.

If an object at equilibrium has a compressibility less than that of the surrounding fluid, the object's equilibrium is stable and it remains at rest. If, however, its compressibility is greater, its equilibrium is then unstable, and it rises and expands on the slightest upward perturbation, or falls and compresses on the slightest downward perturbation.

Submarines rise and dive by filling large tanks with seawater. To dive, the tanks are opened to allow air to exhaust out the top of the tanks, while the water flows in from the bottom. Once the weight has been balanced so the overall density of the submarine is equal to the water around it, it has neutral buoyancy and will remain at that depth. Normally, precautions are taken to ensure that no air has been left in the tanks. If air were left in the tanks and the submarine were to descend even slightly, the increased pressure of the water would compress the remaining air in the tanks, reducing its volume. Since buoyancy is a function of volume, this would cause a decrease in buoyancy, and the submarine would continue to descend.

The height of a balloon tends to be stable. As a balloon rises it tends to increase in volume with reducing atmospheric pressure, but the balloon's cargo does not expand. The average density of the balloon decreases less, therefore, than that of the surrounding air. The balloon's buoyancy reduces because the weight of the displaced air is reduced. A rising balloon tends to stop rising. Similarly a sinking balloon tends to stop sinking.

Density

If the weight of an object is less than the weight of the fluid the object would displace if it were fully submerged, then the object has an average density less than the fluid and has a buoyancy greater than its weight. If the fluid has a surface, such as water in a lake or the sea, the object will float at a level where it displaces the same weight of fluid as the weight of the object. If the object is immersed in the fluid, such as a submerged submarine or air in a balloon, it will tend to rise. If the object has exactly the same density as the fluid, then its buoyancy equals its weight. It will tend neither to sink nor float. An object with a higher average density than the fluid has less buoyancy than weight and it will sink. A ship floats because although it is made of steel, which is more dense than water, it encloses a volume of air and the resulting shape has an average density less than that of the water.

References

  1. ^ "Floater clustering in a standing wave: Capillarity effects drive hydrophilic or hydrophobic particles to congregate at specific points on a wave" (PDF) (2005-06-23).

See also

External links

Look up Buoyancy in
Wiktionary, the free dictionary.

Power-to-weight ratio

From Wikipedia, the free encyclopedia

Power-to-weight ratio (specific power) is a calculation commonly applied to engines and other mobile power sources to enable the comparison of one unit or design to another. Power-to-weight ratio is a measurement of actual performance of any engine or power sources. It is also used a measure of performance of a vehicle as a whole, with the engine's power output being divided by the kerb weight of the car, to give an idea of the vehicle's acceleration.

Power to weight (specific power)

The power-to-weight ratio (Specific Power) formula for an engine (power plant) is the power generated by the engine divided by weight of the engine as follows:

\begin{matrix} \mbox{P-to-W}&=  P/W \\ \end{matrix}

A typical turbocharged V-8 diesel engine might have an engine power of 250 horsepower (190 kW) and a weight of 450 kilograms (1,000 lb), giving it a power to weight ratio of 0.56 kW/kg (0.25 hp/lb).

Examples of high power to weight ratios can often be found in turbines. This is because of their ability to operate at very high speeds. For example, the Space Shuttle's main engines use turbopumps (machines consisting of a pump driven by a turbine engine) to feed the propellants (liquid oxygen and liquid hydrogen) into the engine's combustion chamber. The liquid hydrogen turbopump is slightly larger than an automobile engine (weighing approximately 320 kilograms (700 lb)) and produces nearly 70,000 hp (52.2 MW) for a power to weight ratio of 160 kW/kg (100 hp/lb).

Examples

Engines

Engine Power to weight ratio
Turbocharged V-8 diesel engine 0.25 hp/lb [1]
Space shuttle turbopump 100 hp/lb [2]

Vehicles

Vehicle Power to weight ratio
Ford Focus Sedan 2007[3] 115 hp/ton
Lotus Exige GT3 276 bhp (206 kW)/tonne
McLaren F1 550 hp/ton (403 kW/tonne)
Ultima GTR720 650 bhp (480 kW) per tonne

Batteries

Battery type Power to weight ratio
Nickel-cadmium battery 150W/kg
Lead acid battery 180 W/kg
Nickel metal hydride 250–1000 W/kg
Lithium ion battery 1800 W/kg

The inverse of power-to-weight, weight-to-power ratio (power loading) is a calculation commonly applied to aircraft, cars, and vehicles in general, to enable the comparison of one vehicle performance to another. Weight-to-Power ratio is a measurement of the acceleration capability (potential) of any land vehicle or climb performance of any aircraft or space vehicle.

See also

References

  1. ^ 250 hp (engine power)/1,000 lb (engine weight)
  2. ^ 270,000 hp (turbine power)/700 lb (turbine weight)
  3. ^ http://www.aspecpro.com/browse.php?car=Ford

External links

Thursday, July 24, 2008

Airfoil

From Wikipedia, the free encyclopedia

Various components of the airfoil.

An airfoil (in American English) or (aerofoil in British English) is the shape of a wing or blade (of a propeller, rotor or turbine) or sail as seen in cross-section.

An airfoil-shaped body moved through a fluid produces a force perpendicular to the motion called lift. Subsonic flight airfoils have a characteristic shape with a rounded leading edge, followed by a sharp trailing edge, often with asymmetric camber. Airfoils designed with water as the working fluid are also called hydrofoils.

Introduction

A fixed-wing aircraft's wings, horizontal, and vertical stabilizers are built with airfoil-shaped cross sections, as are helicopter rotor blades. Airfoils are also found in propellers, fans, compressors and turbines. Sails are also airfoils, and the underwater surfaces of sailboats, such as the centerboard and keel, are similar in cross-section and operate on the same principles as airfoils. Swimming and flying creatures and even many plants and sessile organisms employ airfoils; common examples being bird wings, the bodies of fishes, and the shape of sand dollars. An airfoil-shaped wing can create downforce on an automobile or other motor vehicle, improving traction.

Any object with an angle of attack in a moving fluid, such as a flat plate, a building, or the deck of a bridge, will generate an aerodynamic force (called lift) perpendicular to the flow. Airfoils are more efficient lifting shapes, able to generate more lift (up to a point), and to generate lift with less drag.

Lift and Drag curves for a typical airfoil

A lift and drag curve obtained in wind tunnel testing is shown on the right. The curve represents an airfoil with a positive camber so some lift is produced at zero angle of attack. With increased angle of attack, lift increases in a roughly linear relation, called the slope of the lift curve. At about eighteen degrees this airfoil stalls and lift falls off quickly beyond that. Drag is least at a slight negative angle for this particular airfoil, and increases rapidly with higher angles.

Airfoil design is a major facet of aerodynamics. Various airfoils serve different flight regimes. Asymmetric airfoils can generate lift at zero angle of attack, while a symmetric airfoil may better suit frequent inverted flight as in an aerobatic aeroplane. In the region of the ailerons and on near a wingtip a symmetric airfoil can be used to increase the range of angle of attacks to avoid spin-stall. Ailerons itself are not cut into the airfoil, but extend it. Thus a large range of angles can be used without boundary layer separation. Subsonic aeroils have a round leading edge, which is naturally insensitive to the angle of attack. For intermediate Reynolds numbers already before maximum thickness boundary layer separation occurs for a circular shape, thus the curvature is reduced going from front to back and the typical wing shape is retrieved. Supersonic airfoils are much more angular in shape and can have a very sharp leading edge, which - as explained in the last sentence - is very sensitive to angle of attack. A supercritical airfoil has its maximum thickness close to the leading edge to have a lot of length to slowly shock the supersonic flow back to subsonic speeds. Generally such transonic airfoils and also the supersonic airfoils have a low camber to reduce drag divergence. Movable high-lift devices, flaps and sometimes slats, are fitted to airfoils on almost every aircraft. A trailing edge flap acts similar to an aileron, with the difference that it can be retracted partially into the wing if not used (and some flaps even make the plane a biplane if used). A laminar flow wing has a maximum thickness in the middle camber line. Analysing the Navier-Stokes equations in the linear regime shows that a negative pressure gradient along the flow has the same effect as reducing the speed. So with the maximum camber in the middle, maintaining a laminar flow over a larger percentage of the wing at a higher cruising speed is possible. Of course, with rain or insects on the wing or for jetliner like speeds this does not work. Since such a wing stalls more easily, this airfoil is not used on wingtips (spin-stall again).

Schemes have been devised to describe airfoils — an example is the NACA system. Various ad-hoc naming systems are also used. An example of a general purpose airfoil that finds wide application, and predates the NACA system, is the Clark-Y. Today, airfoils are designed for specific functions using inverse design programs such as PROFIL, XFOIL and AeroFoil[1]. X-foil is an online program created by Mark Drela that will design and analyze subsonic isolated airfoils[2]. Modern aircraft wings may have different airfoil sections along the wing span, each one optimized for the conditions in each section of the wing.

An airfoil designed for winglets (PSU 90-125WL)

Airfoil terminology

The various terms related to airfoils are defined below:[1]

  • The mean camber line is a line drawn midway between the upper and lower surfaces.
  • The chord line is a straight line connecting the leading and trailing edges of the airfoil, at the ends of the mean camber line.
  • The chord is the length of the chord line and is the characteristic dimension of the airfoil section.
  • The maximum thickness and the location of maximum thickness are expressed as a percentage of the chord.
  • For symmetrical airfoils both mean camber line and chord line pass from centre of gravity of the airfoil and they touch at leading and trailing edge of the airfoil.
  • The is the chord wise length about which the pitching moment is independent of the lift coefficient and the angle of attack.
  • The center of pressure is the chord wise location about which the pitching moment is zero.
An airfoil section is nicely displayed at the tip of this Denney Kitfox aircraft (G-FOXC), built in 1991.

Thin airfoil theory

A simple mathematical theory of two-dimensional (i.e. with infinite span) thin airfoils was devised by Ludwig Prandtl and others in the 1920s.

The airfoil is modeled as a thin lifting mean-line (camber line). The mean-line, y(x), is considered to produce a distribution of vorticity γ(s) along the line, s. By the Kutta condition, the vorticity is zero at the trailing edge. Since the airfoil is thin, x (chord position) can be used instead of s, and all angles can be approximated as small.

From the Biot-Savart law, this vorticity produces a flow field w(s) where

w(x) = \frac{1} {(2 \pi)} \int_{0}^{c} \frac {\gamma (x')}{(x-x')} dx'

where x is the location at which induced velocity is produced, x' is the location of the vortex element producing the velocity and c is the chord length of the airfoil.

Since there is no flow normal to the curved surface of the airfoil, w(x) balances that from the component of main flow V which is locally normal to the plate - the main flow is locally inclined to the plate by an angle α − dy / dx. That is

V . (\alpha - dy/dx) = w(x) = \frac{1} {(2 \pi)} \int_{0}^{c} \frac {\gamma (x')}{(x-x')} dx'

This integral equation can by solved for γ(x), after replacing x by

\ x = c(1 - cos (\theta ))/2 ,

as a Fourier series in Ansin(nθ) with a modified lead term A0(1 + cos(θ)) / sin(θ)

That is \frac{\gamma(\theta)} {(2V)} = A_0 \frac {(1+cos(\theta))} {sin(\theta)} + \sum  A_n . sin (n \theta))

(These terms are known as the Glauert integral).

The coefficients are given by A_0 = \alpha - \frac {1}{\pi} \int_{0}^{\pi} ((dy/dx) . d\theta

and A_n = \frac {2}{\pi} \int_{0}^{\pi} cos (n \theta) (dy/dx) . d\theta

By the Kutta–Joukowski theorem, the total lift force F is proportional to

 \rho V \int_{0}^{c} \gamma (x). dx

and its moment M about the leading edge to  \rho V \int_{0}^{c} x.\gamma (x) . dx

The calculated Lift coefficient depends only on the first two terms of the Fourier series, as

 \ C_L = 2 \pi (A_0 + A_1/2)

The moment M about the leading edge depends only on A0,A1 and A2 , as

 \ C_M = - 0.5 \pi (A_0+A_1-A_2/2)

The moment about the 1/4 chord point will thus be,

 \ C_M(1/4c) = - \pi /4 (A_1 - A_2) .

From this it follows that the center of pressure is aft of the 'quarter-chord' point 0.25 c, by

 \ \Delta x /c = \pi /4 ((A_1-A_2)/C_L)

The aerodynamic center, AC, is at the quarter-chord point. The AC is where the pitching moment M' does not vary with angle of attack, i.e.

 \frac { \partial (C_{M'}) }{ \partial (C_L)} = 0

References (thin airfoil theory)

  1. http://www.desktopaero.com/appliedaero/airfoils1/tatderivation.html
  2. http://www.aeromech.usyd.edu.au/aero/thinaero/
  3. Batchelor G K (1967), An Introduction to Fluid Dynamics, Cambridge UP, pp467-471

See also

External links

References

  1. ^ Hurt, H. H., Jr. [1960] (January 1965). Aerodynamics for Naval Aviators. U.S. Government Printing Office, Washington D.C.: U.S. Navy, Aviation Training Division, pp. 21-22. NAVWEPS 00-80T-80.
  1. http://http://web.mit.edu/drela/Public/web/xfoil/
All text is available under the terms of the GNU Free Documentation License. (See Copyrights for details.)

Wednesday, July 16, 2008

Wake turbulence

From Wikipedia, the free encyclopedia
Wake turbulence is turbulence that forms behind an aircraft as it passes through the air. This turbulence includes various components, the most important of which are wingtip vortices and jetwash. Jetwash refers simply to the rapidly moving gasses expelled from a jet engine; it is extremely turbulent, but of short duration. Wingtip vortices, on the other hand, are much more stable and can remain in the air for up to three minutes after the passage of an aircraft. Wingtip vortices make up the primary and most dangerous component of wake turbulence.
Wake turbulence is especially hazardous during the landing and take off phases of flight, for three reasons. The first is that during take-off and landing, aircraft operate at low speeds and high angle of attack. This flight attitude maximizes the formation of dangerous wingtip vortices. Secondly, takeoff and landing are the times when a plane is operating closest to its stall speed and to the ground - meaning there is little margin for recovery in the event of encountering another aircraft's wake turbulence. Thirdly, these phases of flight put aircraft closest together and along the same flightpath, maximizing the chance of encountering the phenomenon.

Fixed wing - level flight
At altitude, vortices sink at a rate of 91 to 152 metres per minute and stabilize about 152 to 274 metres below the flight level of the generating aircraft. For this reason, aircraft operating greater than 610 metres above the terrain are not considered at risk.

Helicopters
Helicopters also produce wake turbulence. Helicopter wakes may be of significantly greater strength than those from a fixed wing aircraft of the same weight. The strongest wake can occur when the helicopter is operating at lower speeds (20 to 50 knots). Some mid-size or executive class helicopters produce wake as strong as that of heavier helicopters. This is because two blade main rotor systems, typical of lighter helicopters, produce stronger wake than rotor systems with more blades.

Parallel or crossing runways
During takeoff and landing, an aircraft's wake sinks toward the ground and moves laterally away from the runway when the wind is calm. A 3 to 5 knot crosswind will tend to keep the upwind side of the wake in the runway area and may cause the downwind side to drift toward another runway. Since the wingtip vortices exist at the outer edge of an airplane's wake, this can be dangerous.

Hazard avoidance

Wake vortex separation
ICAO mandates separation minima based upon wake vortex categories that are, in turn, based upon the Maximum Take Off Mass (MTOM) of the aircraft.
These minima are categorised are as follows:
Light - MTOM of 7,000 kilograms or less;
Medium - MTOM of greater than 7,000 kilograms, but less than 136,000 kilograms;
Heavy - MTOM of 136,000 kilograms or greater.
There are a number of separation criteria for take-off, landing and en-route phases of flight based upon these categories. Air Traffic Controllers will sequence aircraft making instrument approaches with regard to these minima. Aircraft making a visual approach are advised of the relevant recommended spacing and are expected to maintain their own separation.

Common minima are:

Take-off
An aircraft of a lower wake vortex category must not be allowed to take off less than two minutes behind an aircraft of a higher wake vortex category. If the following aircraft does not start its take off roll from the same point as the preceding aircraft, this is increased to three minutes.

Landing
Preceding aircraft
Following aircraft
Minimum radar separation
A380-800
A380-800
4 nmi
Non-A380-800 Heavy
6 nmi
Medium
8 nmi
Light
10 nmi
Heavy
Heavy
4 nmi
Medium
5 nmi
Light
6 nmi
Medium
Light
5 nmi

Staying on or above leader's glide path
Incident data shows that the greatest potential for a wake vortex incident occurs when a light aircraft is turning from base to final behind a heavy aircraft flying a straight-in approach. Light aircraft pilots must use extreme caution and intercept their final approach path above or well behind the heavier aircraft's path. When a visual approach following a preceding aircraft is issued and accepted, the pilot is required to establish a safe landing interval behind the aircraft s/he was instructed to follow. The pilot is responsible for wake turbulence separation. Pilots must not decrease the separation that existed when the visual approach was issued unless they can remain on or above the flight path of the preceding aircraft.

Warning signs
Any uncommanded aircraft movements (such as wing rocking) may be caused by wake. This is why maintaining situation awareness is so critical. Ordinary turbulence is not unusual, particularly in the approach phase. A pilot who suspects wake turbulence is affecting his or her aircraft should get away from the wake, execute a missed approach or go-around and be prepared for a stronger wake encounter. The onset of wake can be insidious and even surprisingly gentle. There have been serious accidents where pilots have attempted to salvage a landing after encountering moderate wake only to encounter severe wake turbulence that they were unable to overcome. Pilots should not depend on any aerodynamic warning, but if the onset of wake is occurring, immediate evasive action is vital.

Accidents/incidents due to wake turbulence
June 8, 1966 - an XB-70 collided with an F-104. Though the true cause of the collision is unknown, it is believed that due to the XB-70 being designed to have an enhanced wake turbulence to increase lift, the F-104 moved too close, therefore getting caught in the vortex and colliding the wing (see main article).
May 30, 1972 - Delta Air Lines Flight 9570 crashed at the Greater Southwest International Airport while performing "touch and go" landings behind a DC-10. This crash prompted the FAA to create new rules for minimum following separation from "heavy" aircraft.
December 15, 1993 - a chartered aircraft with five people onboard, including In-N-Out Burger's president, Rich Snyder, crashed at John Wayne International Airport. The aircraft followed in a Boeing 757 for landing, became caught in its wake turbulence, rolled into a deep descent and crashed.
September 8, 1994 - USAir Flight 427 crashed near Pittsburgh, Pennsylvania in 1994. This accident was believed to involve wake turbulence, though the primary cause was a defective rudder control component.
November 12, 2001 - American Airlines Flight 587 crashed into the Belle Harbor neighborhood of Queens, New York shortly after takeoff from John F. Kennedy International Airport. This accident was attributed to pilot error in the presence of wake turbulence from a Japan Airlines Boeing 747 that resulted in rudder failure and subsequent separation of the vertical stabilizer.

Measurement
Wake turbulence can be measured using several techniques. A high-resolution technique is doppler lidar, a solution now commercially available. Techniques using optics can use the effect of turbulence on refractive index (optical turbulence) to measure the distortion of light that passes through the turbulent area and indicate the strength of that turbulence.

Audibility
Wake turbulence can occasionally, under the right conditions, be heard by ground observers. On a still day, heavy jets flying low and slow on landing approach may produce wake turbulence that is heard as a dull roar/whistle. Often, it is first noticed some seconds after the direct noise of the passing aircraft has diminished. The sound then gets louder, sometimes becoming as loud as was the original direct sound of the aircraft. Nevertheless, being highly directional, wake turbulence sound is easily perceived as originating a considerable distance behind the aircraft, its apparent source moving across the sky just as the aircraft did. It can persist for 30 seconds or more, continually changing timbre, sometimes with swishing and cracking notes, until it finally dies away.

In popular culture
In the movie Top Gun, Lieutenant Pete "Maverick" Mitchell, played by Tom Cruise, suffers two flameouts caused by passing through the jet wash of another aircraft. During a training mission Maverick is caught in Tom Kazansky's (played by Val Kilmer) jet wash. Maverick enters a flat spin as a result of an engine flameout, and loses his RIO and best friend "Goose" as they eject out of the plane. In the second incident, he is with "Merlin" and they are caught in a bogey's jet wash. Maverick recovers from the flameout but is shaken up.
In the movie Pushing Tin, air traffic controllers stand at the start of a runway while an airplane lands in order to experience wake turbulence firsthand, although they are more likely being exposed to jet blast.

See also
Wake (of boats)

External links
Captain Meryl Getline explains "Heavy"
The Airman's Information Manual on Wake Turbulence

Retrieved from "http://en.wikipedia.org/wiki/Wake_turbulence"
Categories: Aviation risks Air traffic control Turbulence Wing design


This page was last modified on 12 June 2008, at 08:49.
All text is available under the terms of the GNU Free Documentation License. (See Copyrights for details.) Wikipedia® is a registered trademark of the Wikimedia Foundation, Inc., a U.S. registered 501(c)(3) tax-deductible nonprofit charity.
Privacy policy
About Wikipedia
Disclaimers

Air Navigation

From Wikipedia, the free encyclopedia
The principles of air navigation are the same for all aircraft, big or small. Air navigation involves successfully piloting an aircraft from place to place without getting lost, breaking the laws applying to aircraft, or endangering the safety of those on board or on the ground.
Air navigation differs from the navigation of surface craft in several ways:
Aircraft travel at relatively high speeds, leaving less time to calculate their position en route. Aircraft normally cannot stop in mid-air to ascertain their position at leisure. Aircraft are safety-limited by the amount of fuel they can carry; a surface vehicle can usually get lost, run out of fuel, then simply await rescue. There is no in-flight rescue for most aircraft. And collisions with obstructions are usually fatal. Therefore, constant awareness of position is critical for aircraft pilots.
The techniques used for navigation in the air will depend on whether the aircraft is flying under the visual flight rules (VFR) or the instrument flight rules (IFR). In the latter case, the pilot will navigate exclusively using instruments and radio navigation aids such as beacons, or as directed under radar control by air traffic control. In the VFR case, a pilot will largely navigate using dead reckoning combined with visual observations (known as pilotage), with reference to appropriate maps. This may be supplemented using radio navigation aids.


Route planning
The first step in navigation is deciding where one wishes to go. A private pilot planning a flight under VFR will usually use an aeronautical chart of the area which is published specifically for the use of pilots. This map will depict controlled airspace, radio navigation aids and airfields prominently, as well as hazards to flying such as mountains, tall radio masts, etc. It also includes sufficient ground detail - towns, roads, wooded areas - to aid visual navigation. In the UK, the CAA publishes a series of maps covering the whole of the UK at various scales, updated annually. The information is also updated in the notices to airmen, or NOTAMs.
The pilot will choose a route, taking care to avoid controlled airspace that is not permitted for the flight, restricted areas, danger areas and so on. The chosen route is plotted on the map, and the lines drawn are called the track. The aim of all subsequent navigation is to follow the chosen track as accurately as possible. Occasionally, the pilot may elect on one leg to follow a clearly visible feature on the ground such as a railway track, river, highway, or coast.

Adjustment of an aircraft's heading to compensate for wind flow perpendicular to the ground track
When an aircraft is in flight, it is moving relative to the body of air it is flying in, therefore maintaining an accurate ground track is not as easy as it might appear, unless there is no wind at all — a very rare occurrence. Therefore the pilot must adjust heading to compensate for the wind, in order to follow the ground track. Initially the pilot will calculate headings to fly for each leg of the trip prior to departure, using the forecast wind directions and speeds supplied by the meteorological authorities for the purpose. These figures are generally accurate and updated several times per day, but the unpredictable nature of the weather means that the pilot must be prepared to make further adjustments in flight. A general aviation (GA) pilot will often make use of either the E6B flight computer - a type of slide rule - or a purpose designed electronic navigational computer to calculate initial headings.
The primary instrument of navigation is the magnetic compass. The needle or card aligns itself to magnetic north, which does not coincide with true north, so the pilot must also allow for this, called the magnetic variation (or declination). The variation that applies locally is also shown on the flight map. Once the pilot has calculated the actual headings required, the next step is to calculate the flight times for each leg. This is necessary to perform accurate dead reckoning. The pilot also needs to take into account the slower initial airspeed during climb to calculate the time to top of climb. It is also helpful to calculate the top of descent, or the point at which the pilot would plan to commence the descent for landing.
The flight time will depend on both the desired cruising speed of the aircraft, and the wind - a tailwind will shorten flight times, a headwind will increase them. The E6B has scales to help pilots compute these easily.
The point of no return is the point on a flight at which a plane has just enough fuel, plus any mandatory reserve, to return to the airfield from which it departed. Beyond this point that option is closed, and the plane must proceed to some other destination.
Alternatively, with respect to a large region without airfields, e.g. an ocean, it can mean the point before which it is closer to turn around and after which it is closer to continue.
Additional calculations depending on the aircraft and the terrain may include single engine flight characteristics in the event of a loss of one of a twin's engines in flight.
The final stage is to note over which areas the route will go, and to make a note of all of the things to be done - which ATC units to contact, the appropriate frequencies, visual reporting points, and so on. It is also important to note which pressure setting regions will be entered, so that the pilot can ask for the QNH (air pressure) of those regions. Finally, the pilot should have in mind some alternative plans in case the route cannot be flown for some reason - unexpected weather conditions being the most common. At times the pilot may be required to file a flight plan for an alternate destination and to carry adequate fuel for this. The more work a pilot can do on the ground prior to departure, the easier it will be in the air.

IFR planning
In many respects this is similar to VFR flight planning except that the task is generally made simpler by the use of special charts that show IFR routes from beacon to beacon with the lowest safe altitude (LSALT), bearings (in both directions) and distance marked for each route. IFR pilots may fly on other routes but they then have to do all of these calculations themselves with the LSALT calculation being the most difficult. The pilot then needs to look at the weather and minimum specifications for landing at the destination airport and the alternate requirements. The pilot must also comply with all the rules including their legal ability to use a particular instrument approach depending on how recently they last performed one.

In flight
Once in flight, the pilot must take pains to stick to plan, otherwise getting lost is all too easy. This is especially true if flying over featureless terrain. This means that the pilot must stick to the calculated headings, heights and speeds as accurately as possible. The visual pilot must regularly compare the ground with the map, (pilotage) to ensure that the track is being followed although adjustments are generally calculated and planned. Usually, the pilot will fly for some time as planned to a point where features on the ground are easily recognised. If the wind is different from that expected, the pilot must adjust heading accordingly, but this is not done by guesswork, but by mental calculation - often using the 1 in 60 rule. For example a two degree error at the halfway stage can be corrected by adjusting heading by four degrees the other way to arrive in position at the end of the leg. This is also a point to reassess the estimated time for the leg. A good pilot will become adept at applying a variety of techniques to stay on track.
While the compass is the primary instrument used to determine one's heading, pilots will usually refer instead to the direction indicator (DI), a gyroscopically driven device which is much more stable than a compass. The compass reading will be used to correct for any drift (precession) of the DI periodically. The compass itself will only show a steady reading when the aircraft has been in straight and level flight long enough to allow it to settle.
Should the pilot be unable to complete a leg - for example bad weather arises, or the visibility falls below the minima permitted by the pilot's license, the pilot must divert to another route. Since this is an unplanned leg, the pilot must be able to mentally calculate suitable headings to give the desired new track. Using the E6B in flight is usually impractical, so mental techniques to give rough and ready results are used. The wind is usually allowed for by assuming that sine A = A, for angles less than 60° (when expressed in terms of a fraction of 60° - e.g. 30° is 1/2 of 60°, and sine 30° = 0.5), which is adequately accurate. A method for computing this mentally is the clock code. However the pilot must be extra vigilant when flying diversions to maintain awareness of position.
Some diversions can be temporary - for example to skirt around a local storm cloud. In such cases, the pilot can turn 60 degrees away his desired heading for a given period of time. Once clear of the storm, he can then turn back in the opposite direction 120 degrees, and fly this heading for the same length of time. This is a 'wind-star' maneuver and, with no winds aloft, will place him back on his original track with his trip tme increased by the length of one diversion leg.

Navigation Aids
Main article: Radio navigation


Good pilots use all means available to help navigate. Many GA aircraft are fitted with a variety of radio navigation aids, such as Automatic direction finder (ADF), VHF omnidirectional range (VOR) and Global Positioning System (GPS).
ADF uses non-directional beacons (NDBs) on the ground to drive a display which shows the direction of the beacon from the aircraft. The pilot may use this bearing to draw a line on the map to show the bearing from the beacon. By using a second beacon, two lines may be drawn to locate the aircraft at the intersection of the lines. This is called a cross-cut. Alternatively, if the track takes the flight directly overhead a beacon, the pilot can use the ADF instrument to maintain heading relative to the beacon, though "following the needle" is bad practice, especially in the presence of a strong cross wind - the pilot's actual track will spiral in towards the beacon, not what was intended. NDBs also can give erroneous readings because they use very long wavelengths, which are easily bent and reflected by ground features and the atmosphere. NDBs continue to be used as a common form of navigation in some countries with relatively few navigational aids.
VOR is a more sophisticated system, and is still the primary air navigation system established for aircraft flying under IFR in those countries with many navigational aids. In this system, a beacon emits a specially modulated signal which consists of two sine waves which are out of phase. The phase difference corresponds to the actual bearing relative to true north that the receiver is from the station. The upshot is that the receiver can determine with certainty the exact bearing from the station. Again, a cross-cut is used to pinpoint the location. Many VOR stations also have additional equipment called DME (distance measuring equipment) which will allow a suitable receiver to determine the exact distance from the station. Together with the bearing, this allows an exact position to be determined from a single beacon alone. For convenience, some VOR stations also transmit local weather information which the pilot can listen in to, perhaps generated by an Automated Surface Observing System.
Prior to the advent of GPS, Celestial Navigation was also used by trained navigators on military bombers and transport aircraft in the event of all electronic navigational aids being turned off in time of war. Originally navigators used an astrodome and regular sextant but the more streamlined periscopic sextant was used from the 1940s to the 1990s.
Finally, an aircraft may be supervised from the ground using radar. ATC can then feed back information to the pilot to help establish position, or can actually tell the pilot the position of the aircraft, depending on the level of ATC service the pilot is receiving.
The use of GPS navigation in aircraft is becoming increasingly common. GPS provides very precise aircraft position, altitude, heading and ground speed information. GPS makes navigation precision once reserved to large RNAV-equipped aircraft available to the GA (general aviation) pilot. Recently, more and more airports include GPS instrument approaches. GPS approaches consist of either overlays to existing non-precision approaches or stand-alone GPS non-precision approaches.

See also
ADS-B
Aeronautical chart
Air safety
RAIM
Great-circle distance
ETOPS/LROPS
Flight instruments
Flight management system
Flight planning
Instrument Landing System
Air traffic obstacle
Radio navigation
SIGI
Spherical trig
transatlantic flight
Wind triangle

External links
Fly Away - Air Navigation tutorials
vdeSatellite navigation systems
Historical
Transit (USA)
Operational
GLONASS (USSR/Russia) · GPS (USA) · Beidou (China)
Developmental
COMPASS (China) · Galileo (Europe) · IRNSS (India) · QZSS (Japan)
GNSS augmentation systems
EGNOS · GAGAN · GPS·C · LAAS · MSAS · WAAS · StarFire
Related topics
GNSS · GNSS reflectometry · Kalman filter

vdeFlight instruments
Pitot-static instruments: Altimeter · Airspeed indicator · Machmeter · Variometer
Gyroscopic instruments: Attitude indicator · Heading indicator · Horizontal situation indicator · Turn and bank indicator · Turn coordinator · Turn indicator
Navigation: Horizontal situation indicator · Course Deviation Indicator · Inertial navigation system · GPS · SIGI ·

vdeSatellite navigation systems
Historical
Transit (USA)
Operational
GLONASS (USSR/Russia) · GPS (USA) · Beidou (China)
Developmental
COMPASS (China) · Galileo (Europe) · IRNSS (India) · QZSS (Japan)
GNSS augmentation systems
EGNOS · GAGAN · GPS·C · LAAS · MSAS · WAAS · StarFire
Related topics
GNSS · GNSS reflectometry · Kalman filter
Other: Magnetic compass · Yaw string · Glass cockpit · EFIS
Retrieved from "http://en.wikipedia.org/wiki/Air_navigation"
Categories: Navigation Air traffic control

All text is available under the terms of the GNU Free Documentation License. (See Copyrights for details.) Wikipedia® is a registered trademark of the Wikimedia Foundation, Inc., a U.S. registered 501(c)(3) tax-deductible nonprofit charity.
Privacy policy
About Wikipedia
Disclaimers